I’m building a pipeline for running portfolio optimization studies at scale. The goal is to have a scalable and reliable system to backtest hundreds of trading strategies, in many timeframes, on hundreds of markets. I’m generating quantitative calculations on top of these backtest results and trades, and then use the results to build portfolios. The ultimate goal is to be able to easily implement latest portfolio optimization research, specifically focused on using Reinforcement Learning for manging a live portfolio of bots tradings assets. The strategies I’m using are all open source, and obviously rarely there is any incentive for anyone to open source a strategy that has a real edge over the market. Which becomes apparent as you look at the stats of many individual strategies in differnt timeframes. Therefore I’m also building a scalable way of building models which would ingest market conditions in real-time and supervise each of these strategies as they’re trading, which would help avoid losses and improve returns. Then finally we can construct diffrent portfolios with our desired returns/volatility ratios.
Pipeline
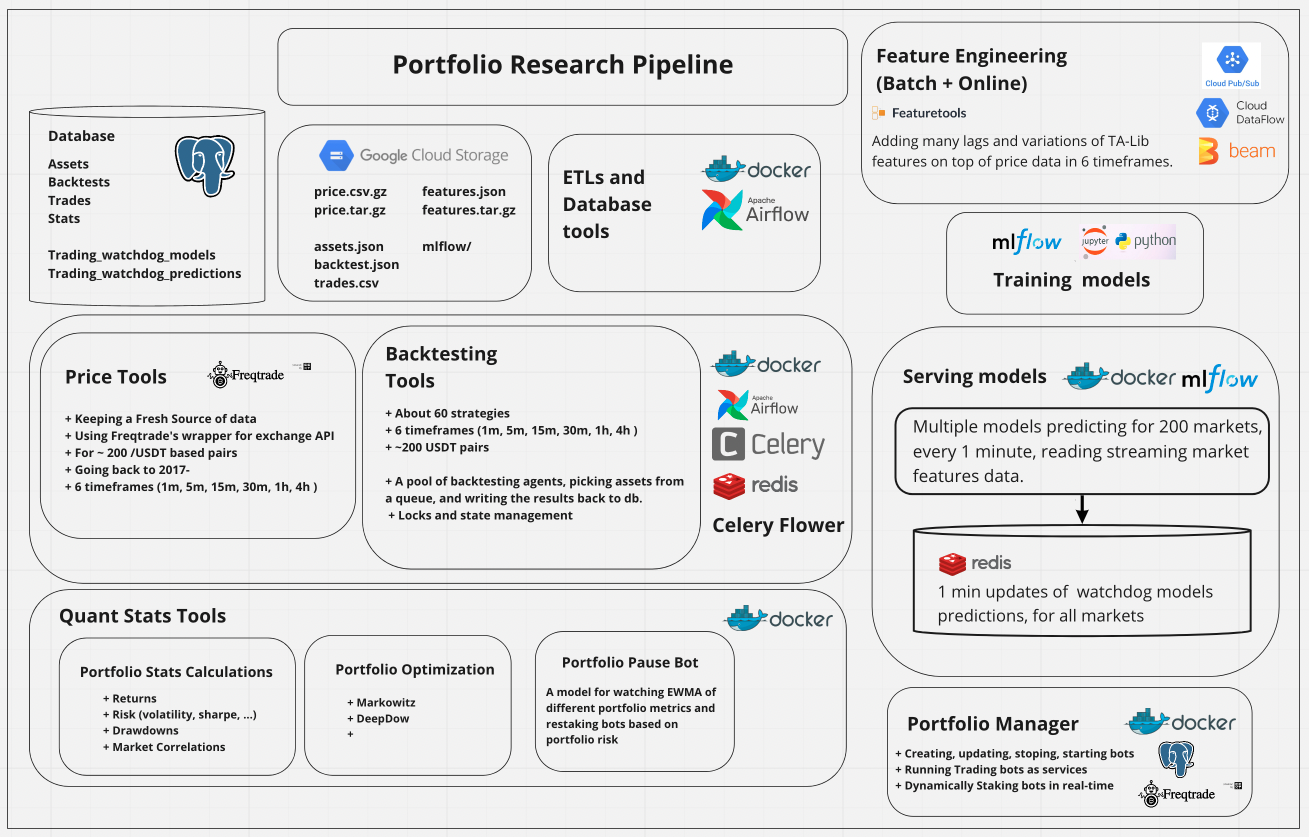
My first attempts were many notebooks, with a lot of pickle files, hacking things together on local. Then I decided scale is key to making things work, so I started designing the pipeline you see here.
The entire backend is written in Python. I use Postgres DB for storing backtest results, quant calculations, and model predictions. All price data, and market features are on GCS. Also many ETL functions moving the data around. For instance moving tens of millions of rows in trades table on postgres to a single json file on GCS.
Backtests are executed by Celery workers. I monitor these worker using Celery Flower. Recently I started running the pipeline in Airflow, with Postgres and CeleryExecutor on the backend. I’ve dockerized the pipeline into different microservices in a single docker-compose.yml file. This has helped a lot with easily spinning up VM instances, and deploying any of the services on demand.
For model training I’m using MLflow with a local sqllite db. These models write their batch market predicictions to Postgres, and their 1m real-time predicitons to Redis.
Backtesting and multiprocessing
A backtest is applying a “strategy-timeframe” on pricing data of many markets (~100 pairs right now, exapanding to ~200). The output is a set of trades. And some statistics calcualted based on those trades. This can be very computationaly expensive. Here’s a little back of the envelope:
- 60 strategies
- 6 timeframes
- 200 pairs
That gives you roughly 72,000 assets to backtest. on about 2-5 years of pricing data, on average.
“1m” pricing data for 200 pairs, is about 5GB of json files, which takes about 20GB with other indicators added in pandas dataframes and loaded in RAM.
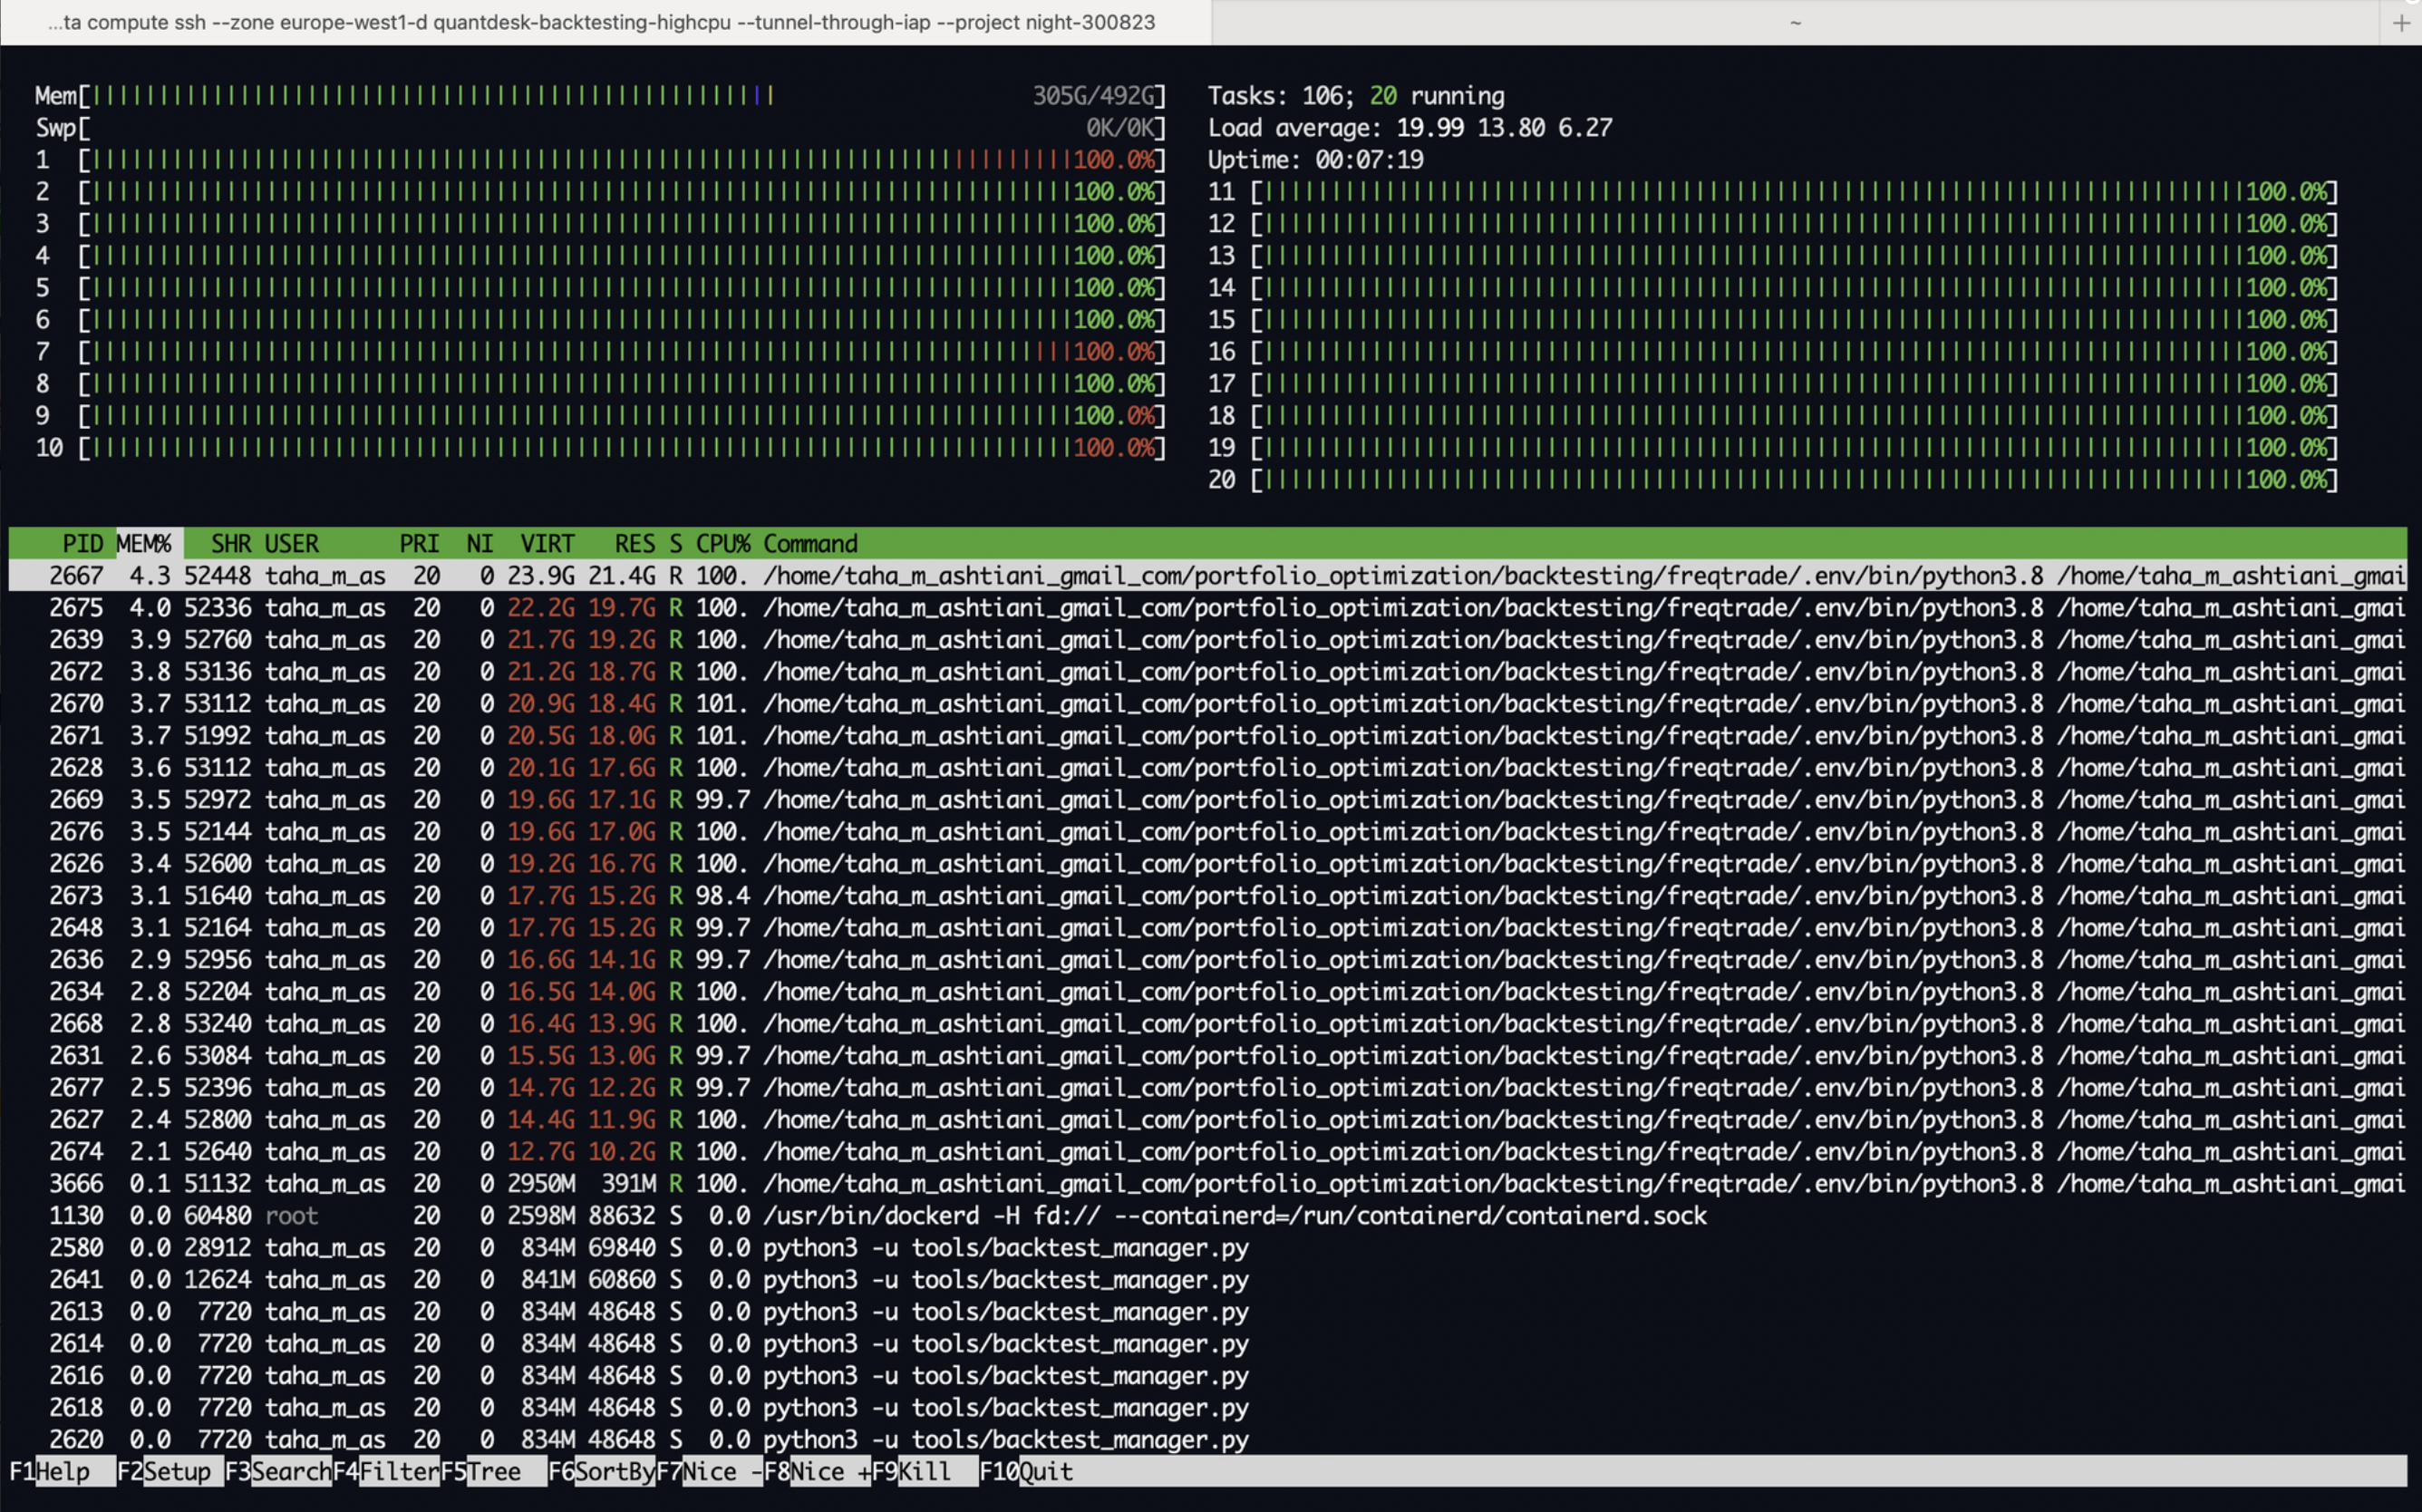
On a single core of C2 CPUs on GCP, it could take about 10minutes to complete, and that’s just one backtest. imagine you have 6 timeframes * 60 starategies = 360 of those. So in order to minimize the compute cost, you’d like to run these in parallel on many cores, which then requires a lot of ram.
I wrote my own multiprocessing, with a pool of agents each grabing a job, putting a lock on it, and executing the job and writing the results back to the database. I spent some time reading about CPU scheduling algorithmgs to build an orechestrator that would exauhst all CPU and RAM continously (for instance “shortest job first”). But then I ended up giving Celery a try. Great solution for autoscaling and exhausting all system resources, and also easy to monitor things. So I migrated everything there, and got rid of a lot of unnecessary complex logic.
Now I have a wroker for each of the backtesting timeframes, subscribed to my Redis broker, ready to execute with --autoscale enabled, to exhaust all VM resources continuously.
And I’m using Celery Flower to monitor and control the Celery processes from a GUI.
celery --app=backtest_agent worker --loglevel=INFO --autoscale=4,1 -Q 1m_tasks -f 1m_worker.log --detach
celery --app=backtest_agent worker --loglevel=INFO --autoscale=10,1 -Q 5m_tasks -f 5m_worker.log --detach
celery --app=backtest_agent worker --loglevel=INFO --autoscale=20,1 -Q 1h_tasks -f 1h_worker.log --detach
Training and Serving Models
I’m calling these supervising models “trading watchdogs”. Now lemme explain what these watchdogs do. Here’s an example for a strategy:
stoploss = -0.3
timeframe = '5m'
dataframe.loc[
            ((dataframe['macd'] > dataframe['macdsignal']) &
             (dataframe['cci'] <= -50.0)),
            'buy'] = 1
We have n (~60) of these strategies in 6 different timeframes, they each take trades, some will be profitable, and some will incur a loss. We have ~10M of these trades for training our models.
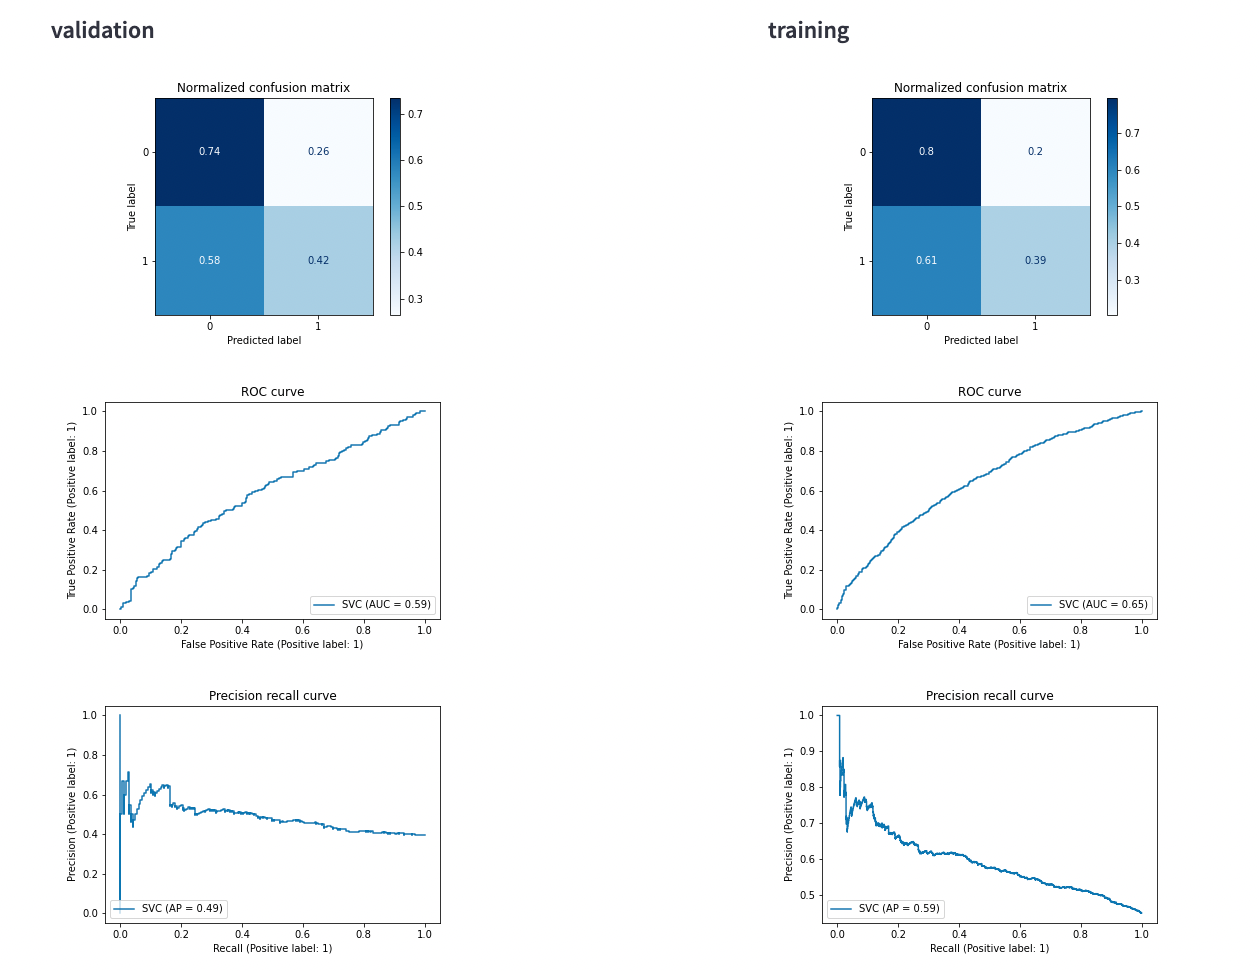
The idea is that these boolean conditions can be supercharged with supervision of a binary classificaiton model, which takes market features as inputs, and predicts the _proba of the bot making a profit or a loss. then we use the _proba predictions of these models to decide how we should move money between our bots under different market conditions, based on their probability of making profit.
Here are some examples of the market features ( t lags are added to these):
[ 'open', 'high', 'low', 'close', 'volume', 'log_return', 'rsi_5', 'bollinger_20_2_bb_lowerband', 'bollinger_20_2_bb_upperband', 'bollinger_20_2_bb_middleband', 'bollinger_20_2_close_bb_lowerband_diff',
'rsi_14', 'macd', 'macdsignal', 'macdhist', 'cci', 'emarsi_5', 'ema100', 'adx', 'sma_200', 'sma_50', 'volume_adi', 'volume_obv', 'volume_cmf', 'volume_fi', 'volume_em', 'volume_sma_em', 'volume_vpt',
'volume_vwap', 'volume_mfi', 'volume_nvi', 'volatility_bbm', 'volatility_bbh', 'volatility_bbl', 'volatility_bbw', 'volatility_bbp', 'volatility_bbhi', 'volatility_bbli', 'volatility_kcc',
'volatility_kch', 'volatility_kcl', 'volatility_kcw', 'volatility_kcp', 'volatility_kchi', 'volatility_kcli', 'volatility_dcl', 'volatility_dch', 'volatility_dcm', 'volatility_dcw', 'volatility_dcp',
'volatility_atr', 'volatility_ui', 'trend_macd', 'trend_macd_signal', 'trend_macd_diff', 'trend_sma_fast', 'trend_sma_slow', 'trend_ema_fast', 'trend_ema_slow', 'trend_vortex_ind_pos', 'trend_vortex_ind_neg',
'trend_vortex_ind_diff', 'trend_trix', 'trend_mass_index', 'trend_dpo', 'trend_kst', 'trend_kst_sig', 'trend_kst_diff', 'trend_ichimoku_conv', 'trend_ichimoku_base', 'trend_ichimoku_a', 'trend_ichimoku_b', 'trend_stc',
'trend_adx', 'trend_adx_pos', 'trend_adx_neg', 'trend_cci', 'trend_visual_ichimoku_a', 'trend_visual_ichimoku_b', 'trend_aroon_up', 'trend_aroon_down', 'trend_aroon_ind', 'trend_psar_up', 'trend_psar_down', 'trend_psar_up_indicator',
'trend_psar_down_indicator', 'momentum_rsi', 'momentum_stoch_rsi', 'momentum_stoch_rsi_k', 'momentum_stoch_rsi_d', 'momentum_tsi', 'momentum_uo', 'momentum_stoch', 'momentum_stoch_signal', 'momentum_wr', 'momentum_ao', 'momentum_roc',
'momentum_ppo', 'momentum_ppo_signal', 'momentum_ppo_hist', 'momentum_kama', 'others_dr', 'others_dlr', 'others_cr']
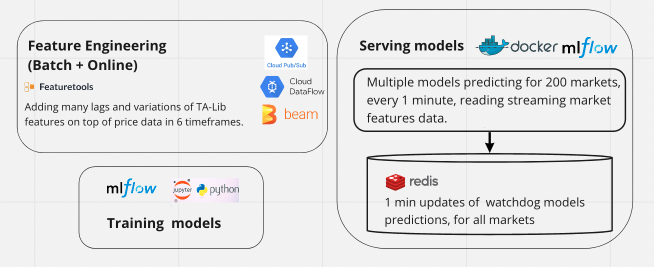
I have a pipeline for loading trading data, adding market features, auto feature selection, preprocessing and finally training models, for each strategy-timeframe. all logged in mlflow. and then the registered models with best val_f1_score are deployed to production.
I need to serve both batch and online predictions using the same pipeline. I have a stream of pricing data from exchange websocket, and need to feed it to my feature engineering pipeline and store the output. I initially wrote some multiprocessing logic for loading price data and adding features and storing in json files. There’re two big problems with this. Adding hunderds of feature columns to millions of rows of pricing data is very computationally expensive. And the dataframes need a lot of RAM, which limits the number of parallel feature engineering processes that you can run on a GCP VM instance. I need serverless horizontal autoscaling. Therefore I decided to keep all of it serverless on GCP. So right now I’m working on having the websocket pricing data published to my GCP Pub/Sub topic, from there to my GCP Dataflow, where I add the features in Beam and write it to csv for batch predictions and to Redis for online predictions.
Every 1min each of my watchdog models read a stream of market features from Redis, and each model dumps its predicitons for ~200 markets back in Redis.
Finally my Portfolio Manger runner reads these predictions every 1min, and decides how to move money between ~10 live bots trading.
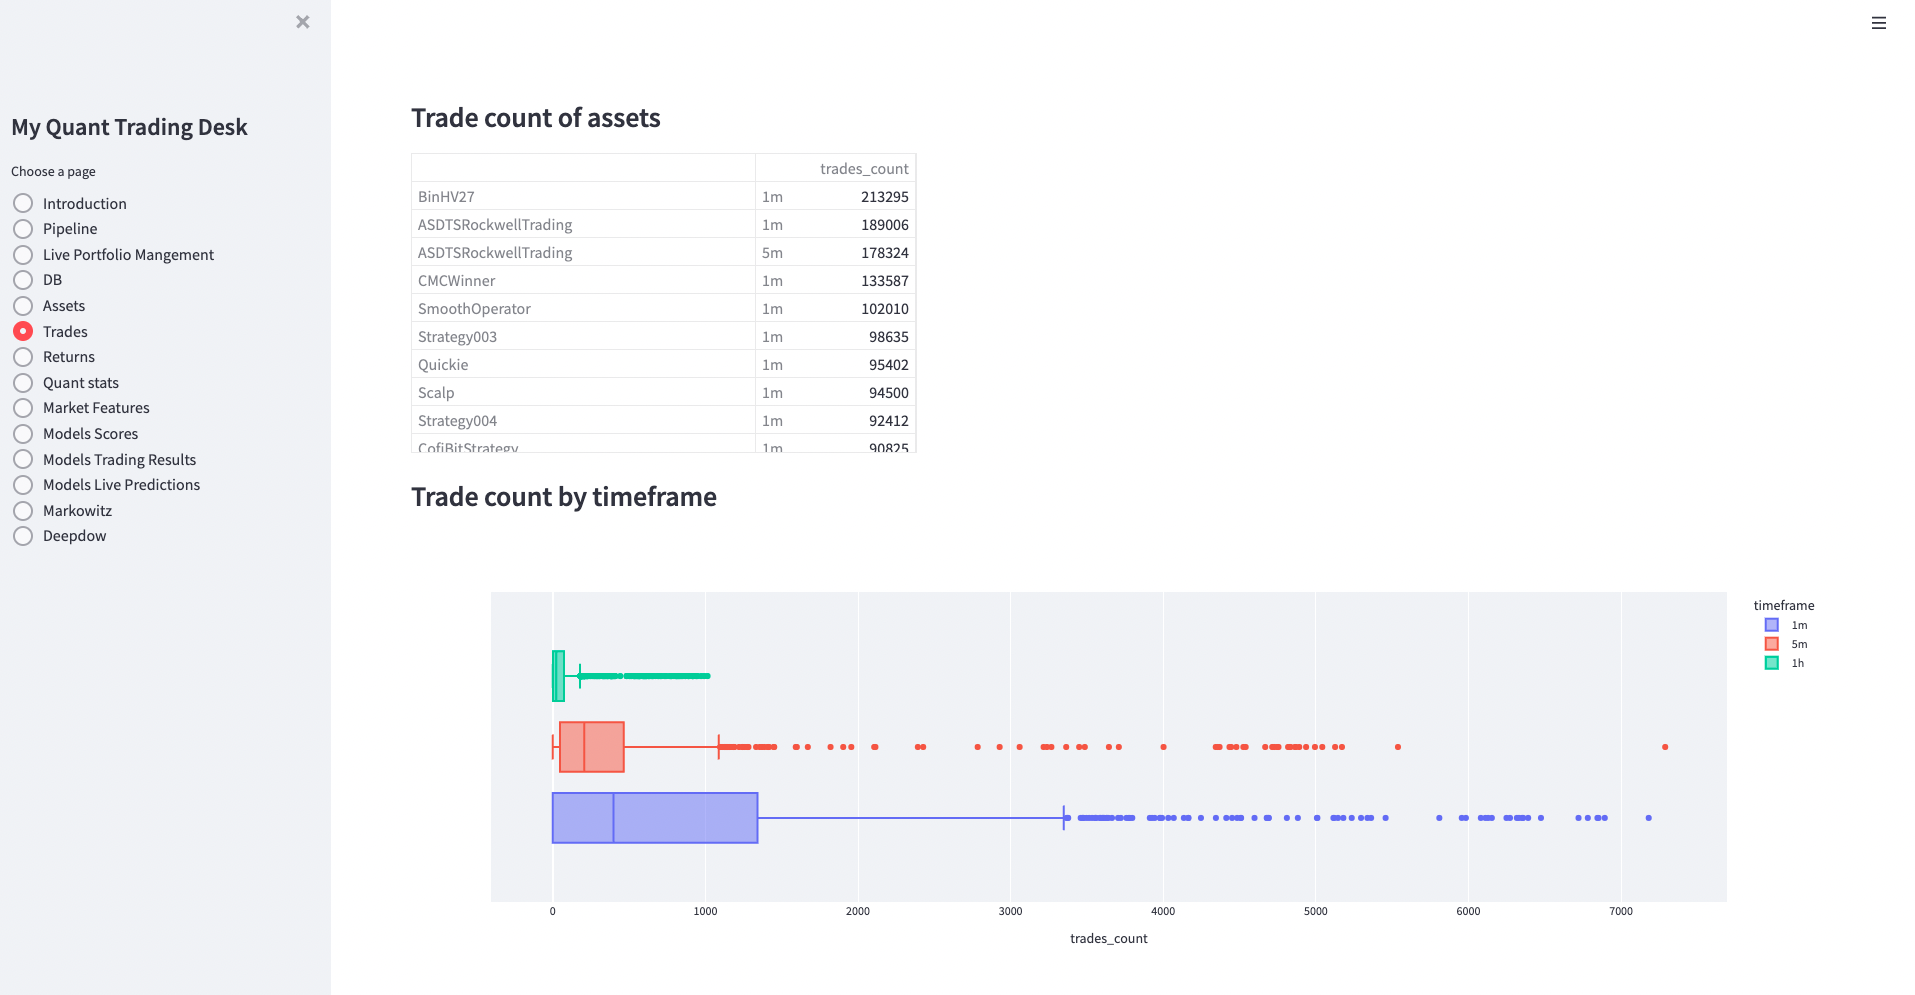
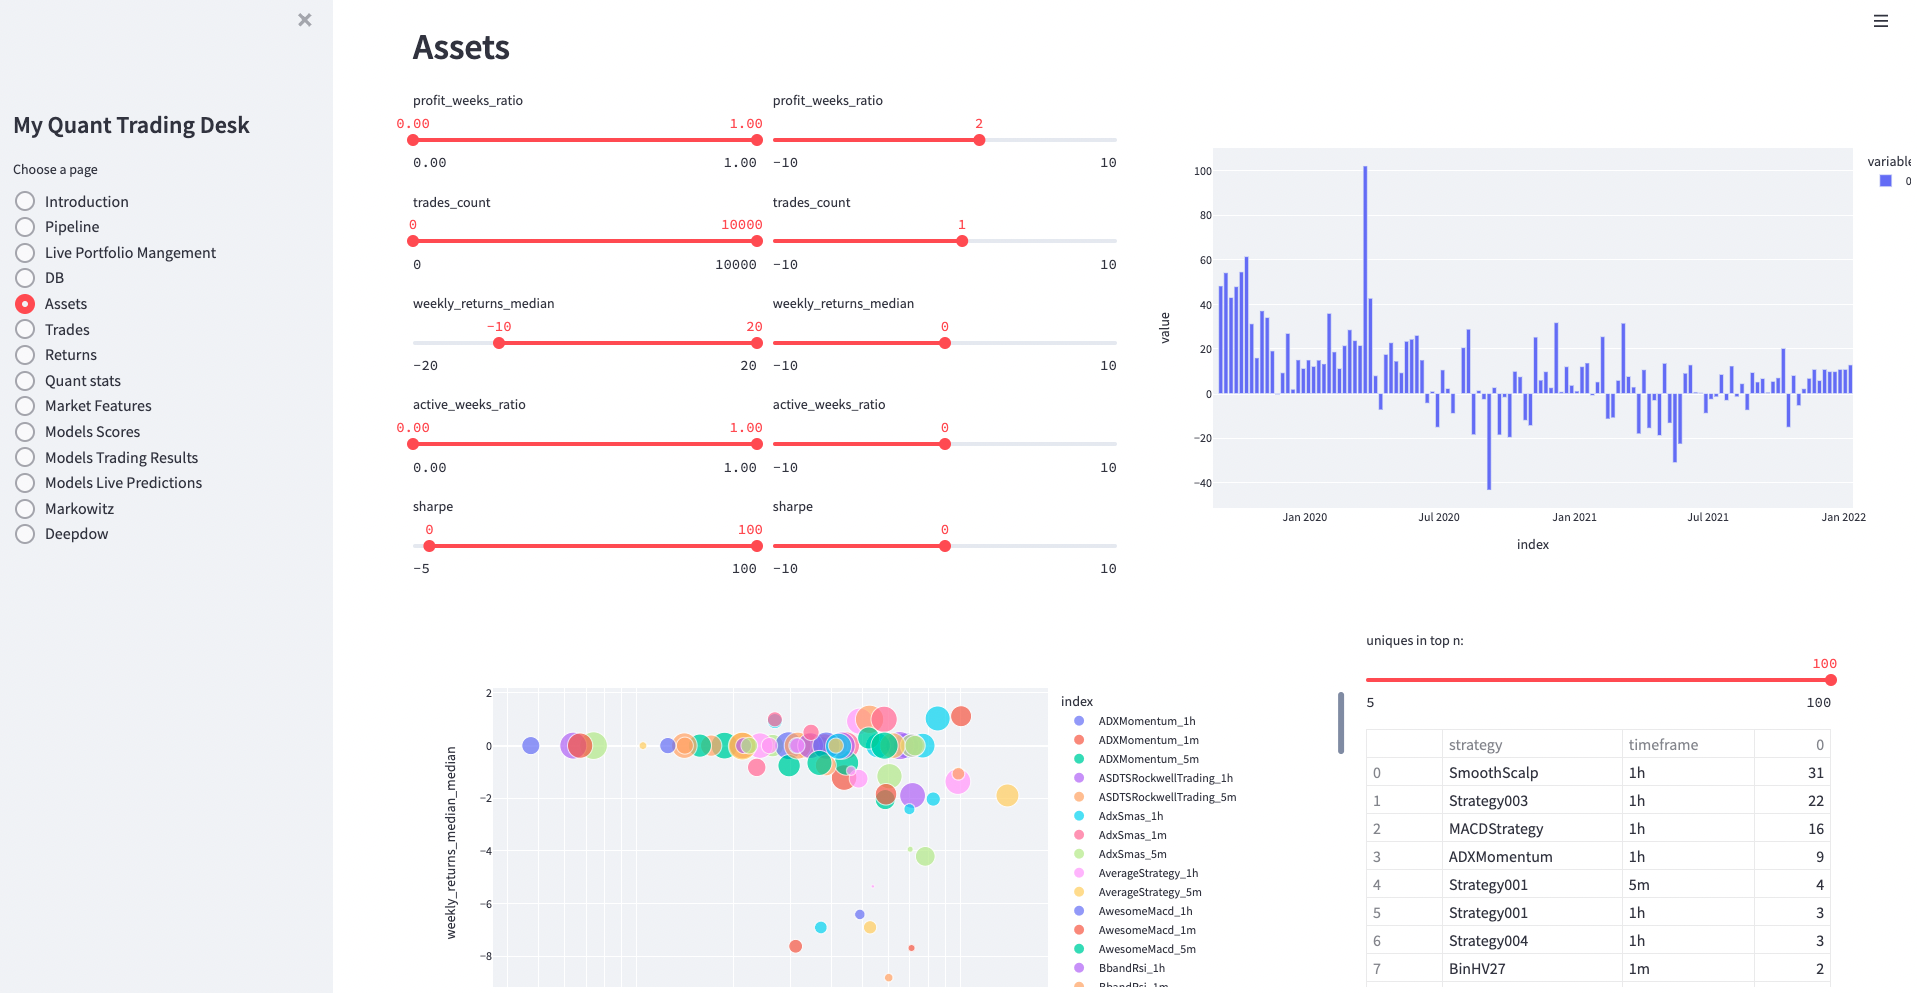
Dashboards and Quant Calcualtions
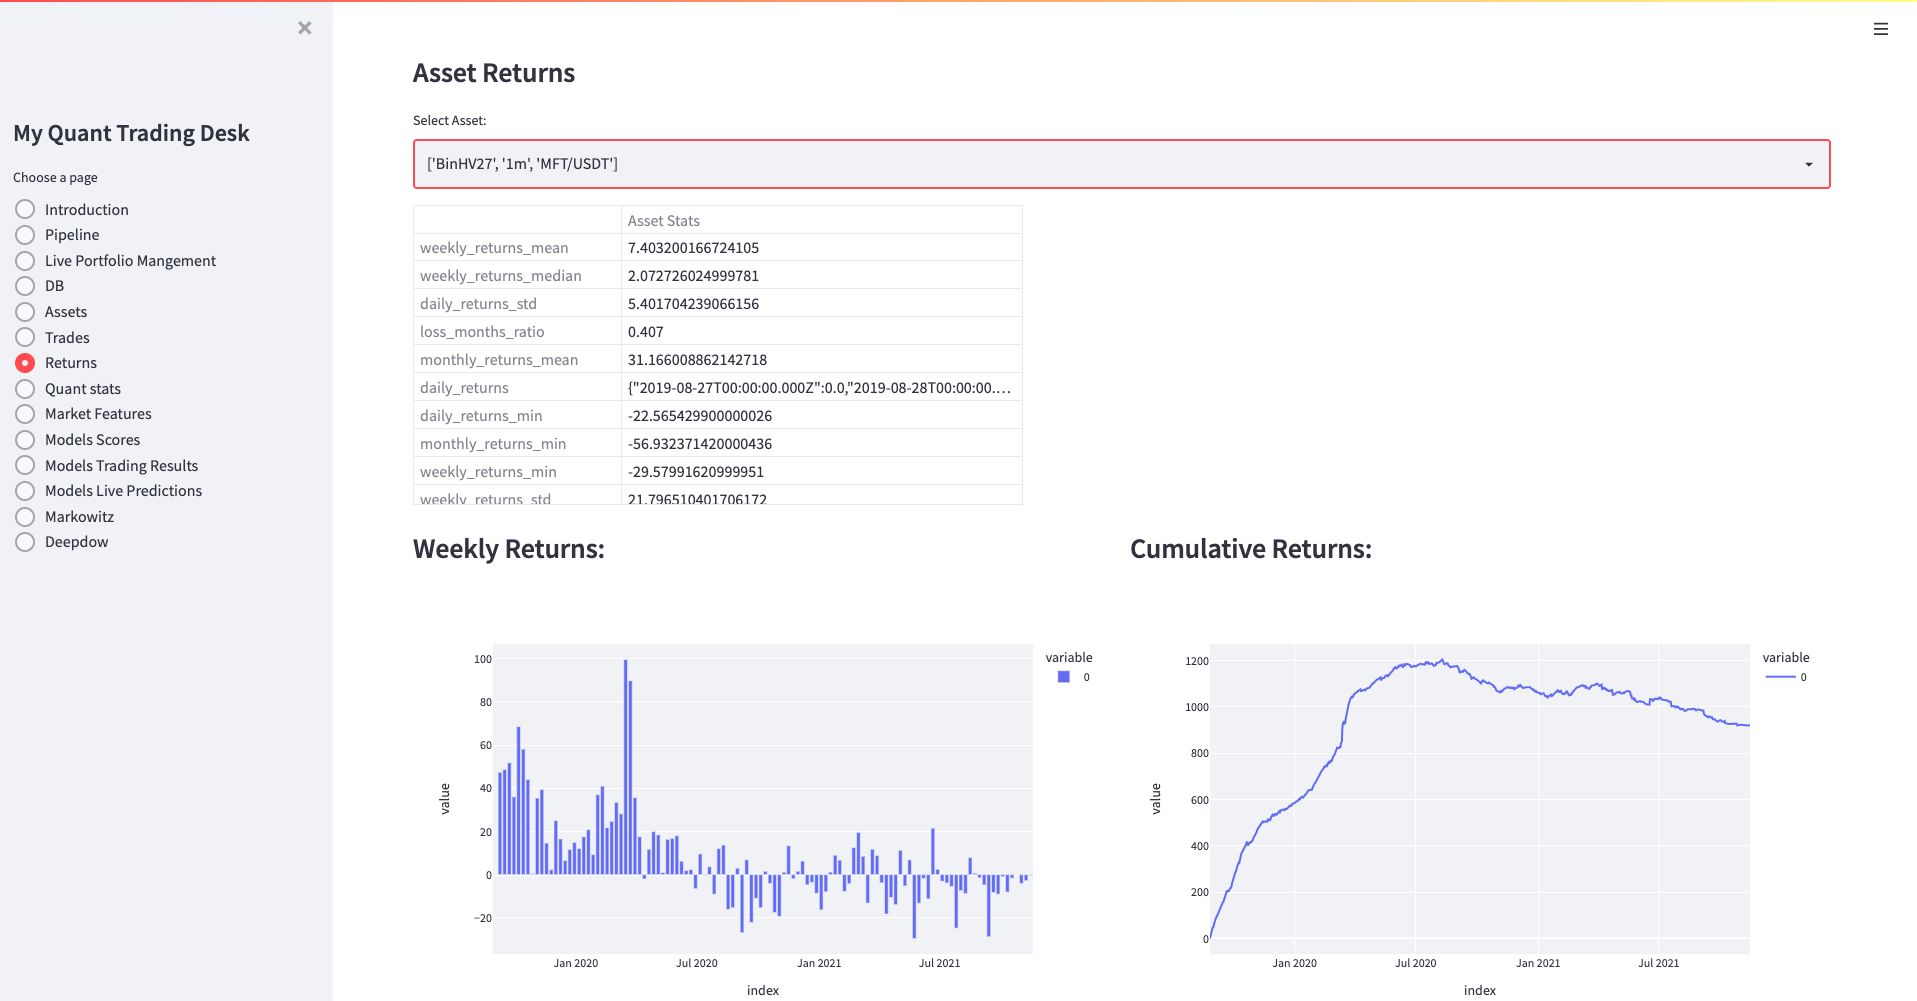 Streamlit, dataframes and plotly plots. I’ve been using streamlit alot at work for our research dashboards.
In order to keep the logic for calculations out of streamlit pages, I have a single notebook which loads many tables from db and some big json files from GCS,
and generates the OLAP dataframes and figures, and stores it all in a single pickled dictionary (~ 100MBs). And it’s fast becuase streamlit caches the pickle after the first time it loads. I just run my notebook from Airflow and it keeps my dashboards updated.
Streamlit, dataframes and plotly plots. I’ve been using streamlit alot at work for our research dashboards.
In order to keep the logic for calculations out of streamlit pages, I have a single notebook which loads many tables from db and some big json files from GCS,
and generates the OLAP dataframes and figures, and stores it all in a single pickled dictionary (~ 100MBs). And it’s fast becuase streamlit caches the pickle after the first time it loads. I just run my notebook from Airflow and it keeps my dashboards updated.