I was looking into Spotify API endpoints and the audio features caught my attention. I decided to gather some data, visualize it and see if I find anything interesting. I found out that I can use the audio features data for predicting the genre for a track. It was quite interesting and I finally decided to write a webapp with some basic browsing features and also the visualizations in this post on top of it.
Calling Spotify endpoints
Spotipy(python wrapper for Spotify API ) has improved a lot over time and is the simplest choice for calling Spotify. let’s initialize it and play with it for a little bit. We’re getting our response as a python dict which we need to turn into pandas DataFrames later on.
import spotipy
from spotipy.oauth2 import SpotifyClientCredentials
import spotipy.util as util

cid = os.environ["SPOTIFY_CID"]
secret = os.environ["SPOTIFY_SECRET"]
username = os.environ["SPOTIFY_USERNAME"]
scope = 'user-library-read playlist-modify-public playlist-read-private user-read-currently-playing user-read-recently-played user-top-read'
redirect_uri = 'http://localhost:8000/connect'

token = util.prompt_for_user_token(username, scope, cid, secret, redirect_uri)
sp = spotipy.Spotify(auth=token)


pd.DataFrame(sp.current_user_playlists())["items"][0]["name"]
'Bass Arcade'

sp.current_user_saved_tracks()["items"][0]["track"]["name"]
'HASH BROWN'

sp.current_user_playing_track()["item"]["name"]
'Little by Little'

sp.current_user_recently_played()["items"][10]["track"]["name"]
'Atlas'
A long list of all the genres on the planet earth :)
We’re gathering a variety of most popular genres from everynoise.com (created by Glenn McDonald). It’s basically a map of all the music genres and sub-genres you can possibly find out there. I’m manually picking the genres based on main music categories and then the subgenres based on popularity. we’re going to use them for collecting a diverse variety of playlists.
read more about everynoise here: http://everynoise.com/EverynoiseIntro.pdf
# http://everynoise.com/everynoise1d.cgi?scope=all
generes  = {'pop':['pop','dance pop', 'post-teen pop', 'electropop', 'tropical house'],
            'hip hop':['hip hop','rap','gangster rap','southern hip hop','hardcore hip hop','conscious hip hop','east coast hip hop','alternative hip hop'],
            'rock':['rock','classic rock', 'permanent wave', 'hard rock', 'modern rock','alternative rock'],
            'edm':['edm','electro house', 'big room', 'pop edm', 'progressive electro house'],
            'latin':['tropical', 'latin pop', 'reggaeton', 'latin hip hop'],
            'metal':['metal','speed metal','hard rock','death metal','thrash metal','power metal']
            }
genres_subgenres = [(g,sg) for g in generes.keys() for sg in generes[g]]
Collecting the playlists
We simply search for the subgenres and for each one get the first 5 results which is added to our playlists dataframe.
def build_playlists():
    playlists = pd.DataFrame()
    for genre,subgenre in genres_subgenres:
        subgenre_playlists = sp.search(subgenre, limit=3, offset=0, type='playlist', market="US")
        df = pd.DataFrame(subgenre_playlists["playlists"])
        df = df[["items"]]
        df["playlist_id"] = df["items"].apply(lambda x:x["id"])
        df["playlist_name"] = df["items"].apply(lambda x:x["name"])
        df["playlist_genre"], df["playlist_subgenre"] = genre , subgenre
        df.drop("items",axis=1,inplace=True)
        playlists = pd.concat([playlists,df],ignore_index=True)

    playlists.drop_duplicates(subset=["playlist_id"],inplace=True)
    return playlists
Audio features and merging 3 dataframes
the final data frame which we’re tying to build, should include track data, features and true genre based on our playlists df. we build the tracks and features dataframe to then merge together with playlists genres.
we’re not using Artists at this point. but it’s useful to store them for some future analysis usecases in the webapp.
def build_dataframes(playlists):
    tracks = pd.DataFrame(columns=["playlist_id","track_id","track_name","track_popularity"])
    artists = pd.DataFrame(columns=["track_id","artist_id","artist_name"])
    features = pd.DataFrame()

    for playlist_id in playlists["playlist_id"]:

        # getting tracks
        playlists_tracks = pd.DataFrame(sp.playlist_tracks(playlist_id))["items"]
        for track in playlists_tracks:
            tracks = tracks.append( {
                            "playlist_id": playlist_id,
                            "track_id": track["track"]["id"],
                            "track_name": track["track"]["name"],
                            "track_popularity": track["track"]["popularity"]
                           }
                        ,ignore_index=True)

        # getting artists
        playlists_tracks = pd.DataFrame(sp.playlist_tracks(playlist_id))["items"]
        for track in playlists_tracks:
            for artist in  track["track"]["artists"]:
                artists = artists.append( {
                                "track_id": track["track"]["id"],
                                "artist_id": artist["id"],
                                "artist_name": artist["name"]
                               }
                            ,ignore_index=True)

        # getting features
        tracks_of_playlist = tracks[(~tracks["track_id"].isnull()) &
                                    (tracks["playlist_id"]==playlist_id)
                                   ]["track_id"]

        features = pd.concat([features,
                              pd.DataFrame(sp.audio_features(tracks_of_playlist))
                            ])
    return tracks,artists,features
now we have tacks, playlists, features . let’s merge them and see how the final dataframe looks like.
def merge_dataframes(tracks,playlists,features):
    songs = tracks.merge(playlists, how="left",on="playlist_id")
    songs = songs.merge(features, how="left",left_on="track_id",right_on="id")
    songs.drop(["id","uri","track_href","analysis_url","type","analysis_url"],axis=1,inplace=True)

		return songs

songs.sample(3)

as the last step of our data collection we can pickle our dataframe. but I also inserted the results into my mongo collection to use in the webapp. I’m writing a seperate post about the webapp.
with open("songs.pkl","wb") as f:
        pickle.dump(songs,f)
import pymongo
client = pymongo.MongoClient("mongodb://localhost:27017/")
db = client["spotify"]
collection = db["user_taste"]

features_dict = songs.to_dict("list")
features_dict["type"] = "all"
features_dict["last_update"] = time.time()

x= collection.update_one({"type":"all"},{"$set":features_dict},upsert=True)
Expoling our Data
let’s start by a value_count to see what we’re working with.
songs["playlist_genre"].value_counts()

rock       611
latin      563
hip hop    561
metal      546
pop        533
edm        500
Name: playlist_genre, dtype: int64
tempo distribution for different genres
This is just an example of how interesting the distributions of the features can be. visualizing the distributions is also at the core of what we’re also serving with our webapp.
...
for genre in songs["playlist_genre"].unique():
    sns.kdeplot(songs[songs["playlist_genre"]==genre]["tempo"],ax=ax)

plt.legend(labels=songs["playlist_genre"].unique())

The edm distribution is so true :)
Distributions of all features across all genres:
...
features_cols = songs.loc[:,"danceability":"tempo"].columns
for i,feature in enumerate(features_cols):
    for genre in songs["playlist_genre"].unique():
        sns.kdeplot(songs[songs["playlist_genre"]==genre][feature],
                    ax=axes[i],
                    label=genre).set_title(feature, fontsize=25)

Correlation between the audio features
at the end of our analysis we’re going to train our classification models. it helps to have a view of the correlation between these audio features which are also going to help us predict the genre.
corr = songs.corr()
mask = np.zeros_like(corr)
mask[np.triu_indices_from(mask)] = True
with sns.axes_style("white"):
    f, ax = plt.subplots(figsize=(20,20))
    ax = sns.heatmap(corr, mask=mask, vmax=.3, square=True,annot=True,cmap="YlGnBu")

let’s take the medians of these features in each genre. scale them and see how genres are correlated with each other. this obviously is ignoring the variance inside the genres but is a nice visualization of the comparison of the genres.
from sklearn.preprocessing import StandardScaler , MinMaxScaler

corr_features = ['danceability', 'energy', 'speechiness',
       'acousticness', 'liveness', 'valence','playlist_genre']

genres_features_median = songs[corr_features].groupby(["playlist_genre"]).median()
genres_for_columns = genres_features_median.columns
scaler = StandardScaler()
genres_features_median[genres_for_columns] = scaler.fit_transform(genres_features_median)
sns.heatmap(genres_features_median.T.corr(),annot=True,cmap="YlGnBu")
The high correlation of metal-edm and pop-latin make a lot of sense.

Training our classification models
Our data is pretty clean right. but still we need to get rid of some outliers and drop some columns, which would otherwise throw our models off.
...
sns.boxplot(x=songs["duration_ms"],ax=axes[0])
songs = songs[songs["duration_ms"] < 0.5*10**6]
sns.boxplot(x=songs["duration_ms"],ax=axes[1])

data = songs.drop(["playlist_id","track_id","track_name","playlist_name","playlist_subgenre","track_popularity"],axis=1)
train/test split , features and classes
y = data["playlist_genre"]
X = data.drop(["playlist_genre"],axis=1)
X_train, X_test, y_train, y_test = train_test_split(X,y, test_size=0.2)

feature_names = X.columns
classes = y_test.unique()
Trying different classification algorithms
I’m using a helper function to loop over the models below. It is looping over each classifier, building a pipeline with a MinMaxScaler, fitting it, and finally calculating the accuracy for us to compare.
class ModelSelection:
    def __init__(self, models, params):
        if not set(models.keys()).issubset(set(params.keys())):
            missing_params = list(set(models.keys()) - set(params.keys()))
            raise ValueError(f"Some estimators are missing parameters: {missing_params}" )
        self.models = models
        self.params = params
        self.keys = models.keys()
        self.grid_searches = {}

    def fit(self, X, y, cv=3, n_jobs=3, verbose=1, scoring=None, refit=False):
        for key in self.keys:
            print(f"Running GridSearchCV for {key}.")
            model = self.models[key]
            params = self.params[key]
            scaler = MinMaxScaler()
					  #scaler = StandardScaler()
            pipe = Pipeline(steps=[('scaler', scaler),
                                   (key, model)])

            gs = GridSearchCV(pipe, params, cv=cv, n_jobs=n_jobs,
                              verbose=verbose, scoring=scoring, refit=refit,
                              return_train_score=True)
            gs.fit(X,y)
            self.grid_searches[key] = gs

    def score_summary(self, sort_by='mean_score'):
        def row(key, scores, params):
            d = {
                 'estimator': key,
                 'min_score': min(scores),
                 'max_score': max(scores),
                 'mean_score': np.mean(scores),
                 'std_score': np.std(scores),
            }
            return pd.Series({**params,**d})

        rows = []
        for k in self.grid_searches:
            print(k)
            params = self.grid_searches[k].cv_results_['params']
            scores = []
            for i in range(self.grid_searches[k].cv):
                key = f"split{i}_test_score"
                r = self.grid_searches[k].cv_results_[key]
                scores.append(r.reshape(len(params),1))

            all_scores = np.hstack(scores)
            for p, s in zip(params,all_scores):
                rows.append((row(k, s, p)))

        df = pd.concat(rows, axis=1).T.sort_values([sort_by], ascending=False)

        columns = ['estimator', 'min_score', 'mean_score', 'max_score', 'std_score']
        columns = columns + [c for c in df.columns if c not in columns]

        return df[columns]
models1 = {
    'RandomForestClassifier': RandomForestClassifier(),
    'GradientBoostingClassifier': GradientBoostingClassifier(),
    'LogisticRegression':LogisticRegression(),
    'SVC': SVC(),
    'AdaBoostClassifier':AdaBoostClassifier(),
    'KNeighborsClassifier':KNeighborsClassifier()
}
RandomForestClassifier had the best results with about %63 accuracy. you can checkout the whole model selection function on the notebook. here we fit our random forest again to see how it’s actually doing in action.
forest = RandomForestClassifier(random_state=0)
forest.fit(X_train,y_train)

accuracy, metrics = build_metrics(forest,X_test,y_test,classes)
print("Random Forest Accuracy: ",accuracy)
display(metrics)

# Random Forest Accuracy: 0.63

The classifier’s success in predicting the right genres is varying depending on the actual genre. let’s look at the confusion matrix to see where our models is struggling.
...
conf_matrix =  confusion_matrix(y_test, forest.predict(X_test));
sns.heatmap(conf_matrix, cmap='Blues',annot=True ,xticklabels=classes, yticklabels=classes);

the on the y axis we have the true genres and on x we have the predictions. so for example it seems like our random forest is confusing some edm tracks with pop.
It might help to list these tracks in order to get a feel of why that is the case.
Confusion_X_test = X_test.copy()
Confusion_X_test["true_genres"] = y_test.values
Confusion_X_test["forest_predictions"] = forest.predict(X_test)
confused = Confusion_X_test[ (Confusion_X_test["forest_predictions"] == "pop") &
					                   (Confusion_X_test["true_genres"] == "edm")
											      ]
confused = confused.merge(songs[["track_name"]],left_index=True,right_index=True)[["track_name","true_genres","forest_predictions"]]
confuse

Importance of features for Random Forest
looking at the feature_importances of our random forest it seems like speechiness, danceability, accousticness are the most important features for our genre prediction.
You can also see how that is the case by fitting and drawing a decision tree.
feature_importances = pd.DataFrame(zip(X.columns, forest.feature_importances_))
feature_importances.set_index(0,inplace=True)
feature_importances.sort_values(1,ascending=True,inplace=True)
feature_importances.plot.barh(ax=ax)

dt = DecisionTreeClassifier(criterion="gini",max_depth=7)
dt.fit(X_train,y_train)
dot_data = export_graphviz(dt, out_file=None,
                            feature_names=feature_names,
                            class_names=classes)
graph = Source(dot_data)
png_bytes = graph.pipe(format='png')
with open('spotify_decision_tree.png','wb') as f:
    f.write(png_bytes)
Comparing our accuracy with a baseline
what accuracy should we expect if we just randomly guess the genres as a prediction? well, there should be a 1/6 = %16 chance for us to be right about each genre. which then gives us an accuracy of about %16. I wrote the code for it anyways. Our best accuracy score was %63 which is doing much better than the baseline.
baseline_y_predicitons = pd.Series([random.choice(classes) for _ in range(y_test.shape[0]) ])
correct_predictions = (baseline_y_predicitons.reset_index(drop=True) == y_test.reset_index(drop=True)).sum()
baseline_accuracy = "%.2f"%(correct_predictions / y_test.shape[0])
baseline_accuracy

'0.18'
Building the WebApp
Now lets build an interface for the visualizations and the genre predictions.
The stack of the webapp
The backend is a RESTful API served by Django. The single page frontend is built with React and served fully statically by nginx. I’ve used 2 databases. Postgres for storing user profiles, tokens, liked tracks and … in different tables. And mongoDB as a great nosql solution for storing the audio features, analysis and taste for hundreds of thousands of tracks stored for both users and publicly. The data for building the charts is coming from mongoDB. The Postgres is hosted on AWS RDS, and the mongoDB on the EC2 instance.
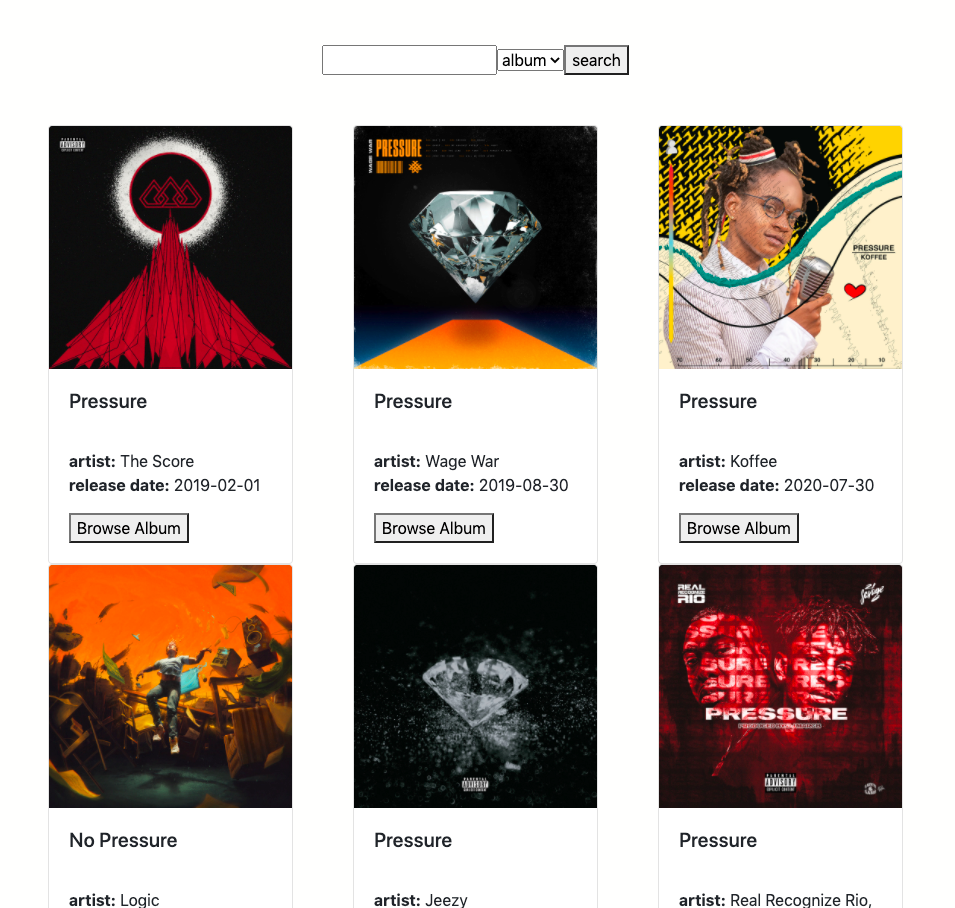
Browse, Search, and top tracks
The goal is to make the analysis of tracks browsable and accessible. You can browse and search playlists, albums, and tracks. There is a list of your top tracks, and also the track you’re currently playing on your Spotify app.
The Endpoints
I’ve kept most of the logic and processing of json responses on the backend. Otherwise the react code would turn into a big mess, as we add more features. I have written few utils functions on top of Spotipy for transforming spotify json responses and making them ready to be stored in DB and consumed by the webapp.
### Searching ###
/rest/search
GET: search for a track, artist, album


### User Data ###

/rest/me
GET: get user's profile

/rest/nowplaying
GET: get user's currently playing track

/rest/toptracks
GET: get user's top tracks

/rest/likedtracks
GET: get user's all liked tracks


### Browsing ###

/rest/categories
GET: get all categories from spotify

/rest/playlists?category_id=3xG8X...
GET: get all playlists of a category from spotify

/rest/playlist_tracks?playlist_id=3xG8X...
GET: get all tracks of a playlist from spotify

/rest/album_tracks?album_id=3xG8X...
GET: get all tracks of an album from spotify


### Analysis and Taste ###

/rest/analysis
GET: get analysis for track

/rest/taste
GET: get the taste charts for a user
Storing features, analysis, and taste objects in mongo
Audio features, user tastes and public taste are all stored in mongo. for example public taste collection contains distribution of different audio features of all genres. These distributions are fetched, transformed and inserted into the mongo and served for the frontend, to be used for distribution charts.
client = pymongo.MongoClient("mongodb://localhost:27017/")
db = client["spotify"]
collection = db["charts"]

features_dict = liked_songs.to_dict("list")
features_dict["type"] = "user"
features_dict["last_update"] = time.time()

x= collection.update_one({"type":"user","username":username},{"$set":features_dict},upsert=True)
Building user taste objects:
def update_users_tastes():
    users = User.objects.all()
    for user in users:
        profile = Profile.objects.filter(user=user)
        if profile.exists():
            profile = profile[0]
            username = user.username
            token = profile.token
            sp = spotipy.Spotify(auth=token)

            # merge user liked tracks with features
            liked_tracks = get_user_liked_tracks(profile)
            liked_tracks_features = get_tracks_features(sp,liked_tracks)
            liked_tracks_df = read_frame(liked_tracks)
            taste = liked_tracks_df.merge(liked_tracks_features, how="left",left_on="track_id",right_on="track_id")
            taste.drop(["id_x","profile","id_y","uri","track_href","track_item"],axis=1,inplace=True)

            # update the document in mongo
            taste_dict = taste.to_dict("list")
            taste_dict["username"] = username
            taste_dict["type"] = "user"
            taste_dict["genre"] = "all"
            taste_dict["last_update"] = time.time()
            x= user_taste_collection.update_one({"username":str(username)},{"$set":taste_dict},upsert=True)

        else:
            pass
Querying public or user taste from mongo:
def get_taste(username=None):
    public_taste = user_taste_collection.find_one({"type":"all"})
    del public_taste["_id"]
    if username:
        user_taste = user_taste_collection.find_one({"type":"user","username":username})
        del user_taste["_id"]
    else:
        user_taste =  {}
    return user_taste , public_taste
> use spotify
switched to db spotify

> show collections
analysis
tracks_features
user_taste
public_taste

> db.tracks_features.find({"track_id":"0atOMgnZQ0bkSzDacwkKwB"}).pretty()
{
	"_id" : ObjectId("5f25c9b0a651570eeb1f7484"),
	"track_id" : "0atOMgnZQ0bkSzDacwkKwB",
	"features" : {
		"danceability" : 0.264,
		"energy" : 0.335,
		"key" : 7,
		"loudness" : -15.879,
		"mode" : 0,
		"speechiness" : 0.0361,
		"acousticness" : 0.0348,
		"instrumentalness" : 0.819,
		"liveness" : 0.17,
		"valence" : 0.0347,
		"tempo" : 89.195,
		"type" : "audio_features",
		"id" : "0atOMgnZQ0bkSzDacwkKwB",
		"uri" : "spotify:track:0atOMgnZQ0bkSzDacwkKwB",
		"track_href" : "https://api.spotify.com/v1/tracks/0atOMgnZQ0bkSzDacwkKwB",
		"analysis_url" : "https://api.spotify.com/v1/audio-analysis/0atOMgnZQ0bkSzDacwkKwB",
		"duration_ms" : 343733,
		"time_signature" : 4
	},
	"last_pull_date" : 1596311990.86658
}
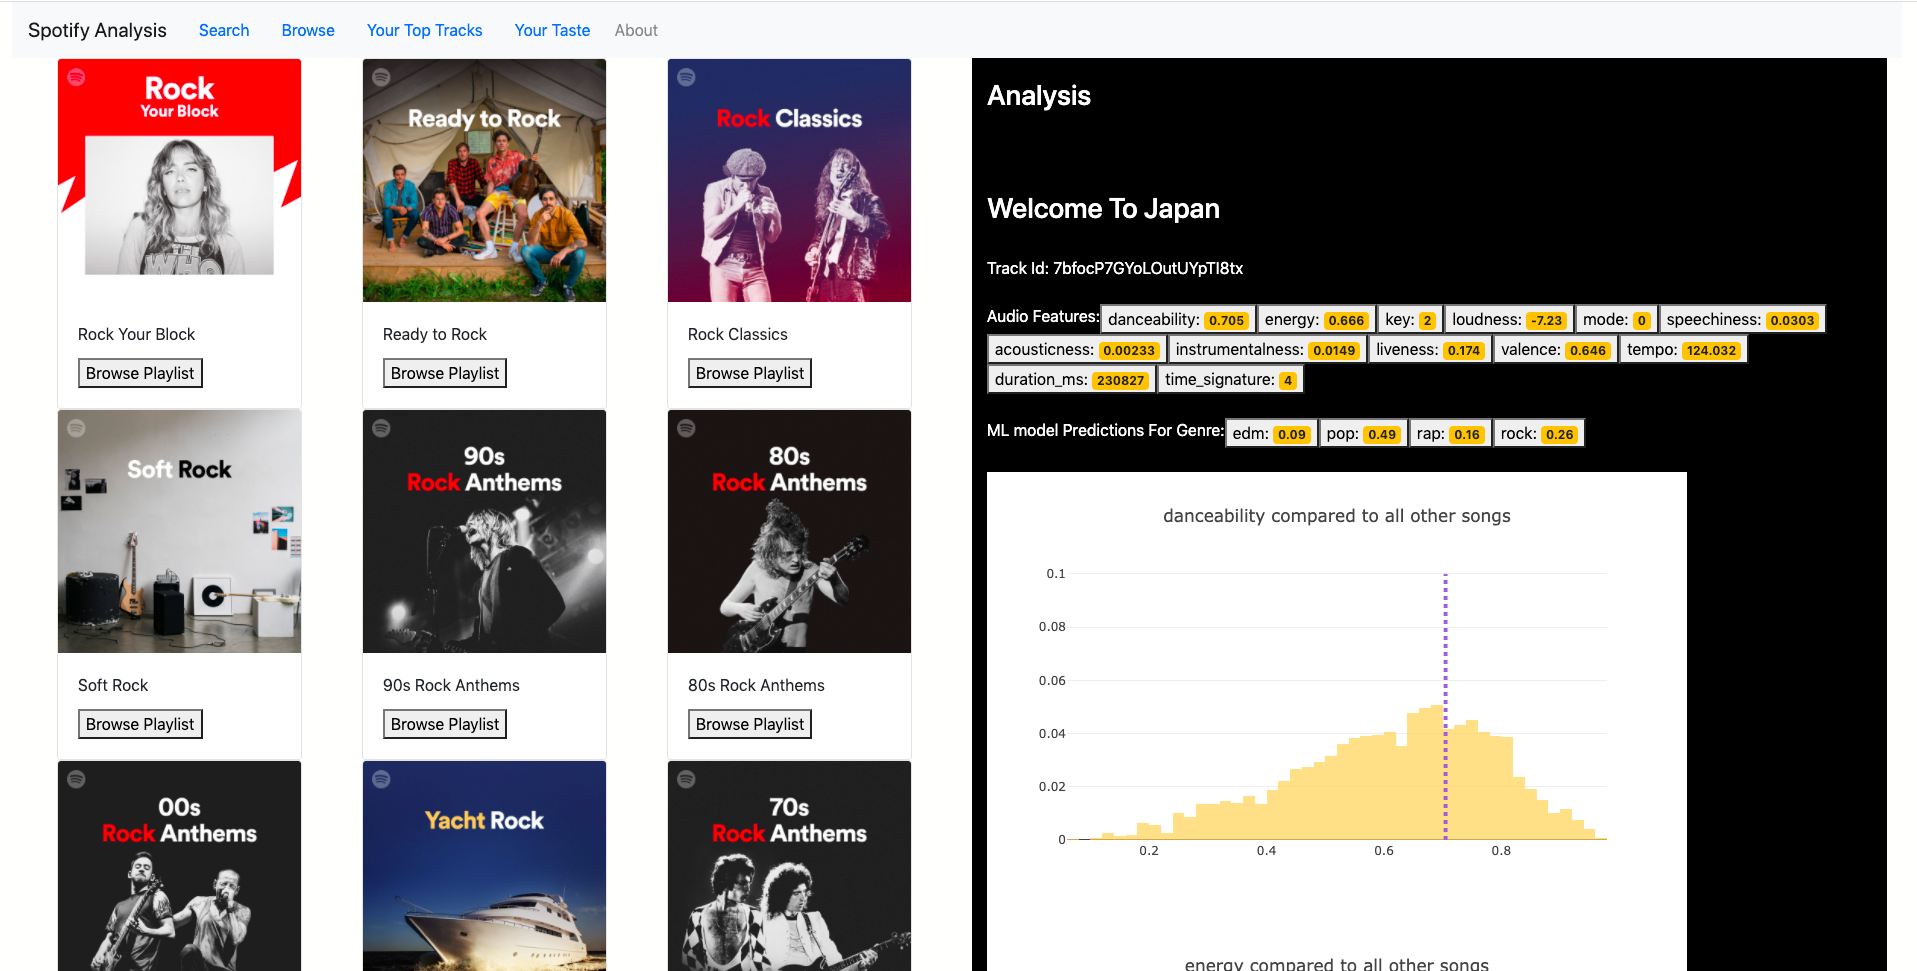
Serving analysis charts and genre predictions
Every time the analysis endpoint is called for a track, we check if there is an analysis ready in our mongo. If not, we generate one with audio features and genre predictions, store it and serve it then. So when a user looks up a track for the second time It will be faster and more efficient. Here is the function for making the analysis.
...

clf = pickle.load(clf_pkl)

def make_analysis(token,track_id):
    audio_features_results = sptools.get_audio_features(token,track_id)
    audio_features_results = drop_key_from_dict(audio_features_results,["type","id","uri","track_href","analysis_url"])
    audio_features = np.array(list(audio_features_results.items()))[:,1].astype(float).reshape(1,-1)

    p = clf.predict_proba(audio_features)
    genre_prediction = dict(zip(clf.classes_,p[0]))
    track_meta= sptools.get_track(token,track_id)
    analysis_dict = {
                "track_id":track_id,
                "track_name": track_meta["name"],
                "track_meta": track_meta,
                "features":audio_features_results,
                "genre_prediction":genre_prediction,
                }
    x= Analysis_collection.update_one({"track_id":track_id},{"$set":analysis_dict},upsert=True)
    return analysis_dict
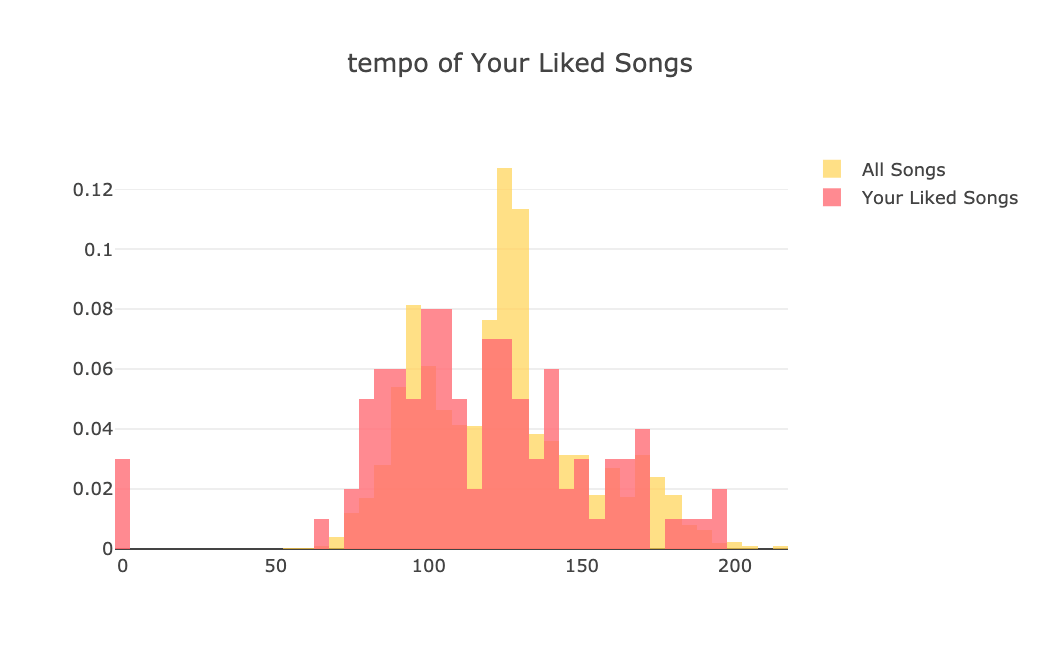
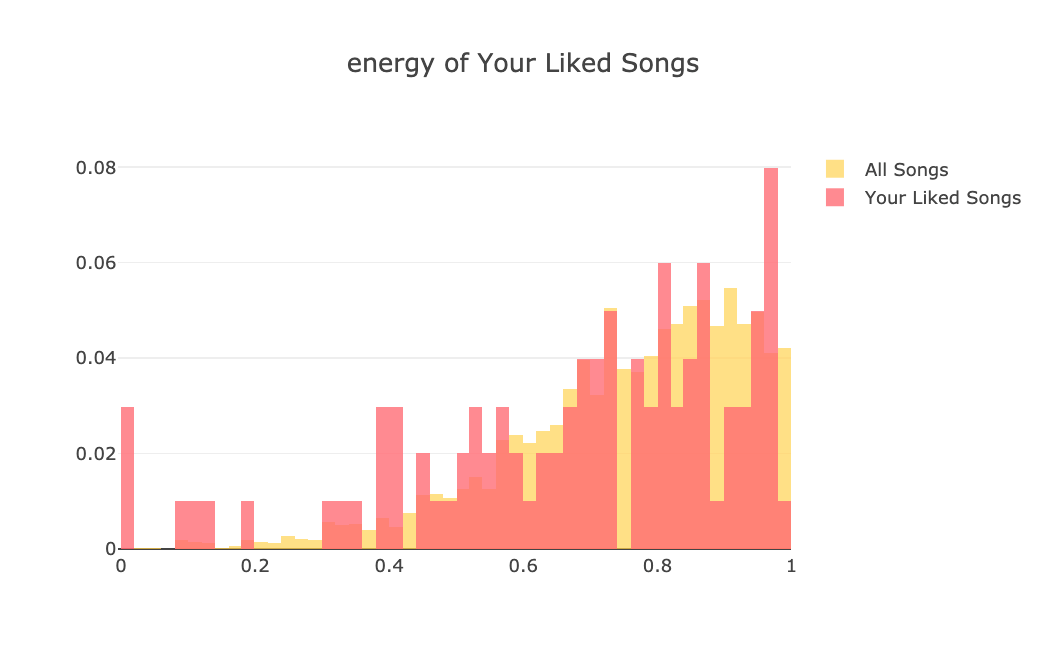
From this point on, I will be adding more analytical features and visualizations to make it more interesting and useful. Right now we’re comparing user taste with the public taste (all other tracks). Imagine doing the same for two individual users. So for example I can share a link with my friend and then we can both see how our tastes are different.
Or another cool feature could be visualizing the rhythm and tempo of a track as it is playing. I’m satisfied with what we have right now. Stay tuned as I will be adding new cool features to it.
Cheers!